
Page 15 - Aygaz-Sustainability-Report-2021
P. 15
SUSTAINABILITY REPORT 2021 13
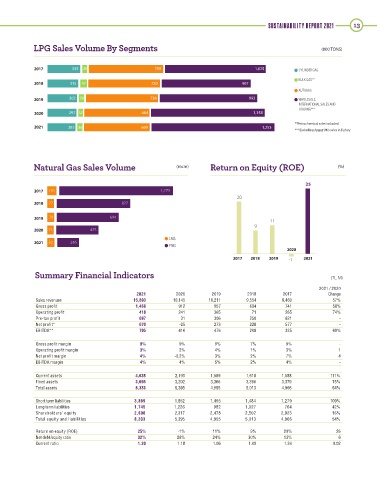
LPG Sales Volume By Segments (000 TONS)
2017 335 35 759 1,025 CYLINDER GAS
BULK GAS**
2018 315 47 730 907
AUTOGAS
2019 302 38 734 993 WHOLESALE,
INTERNATIONAL SALES AND
TRADING***
2020 297 32 664 1,158
**Petrochemical sales included
2021 287 36 669 1,253
*** Excluding Aygaz UK’s sales in Turkey
Natural Gas Sales Volume (mcm) Return on Equity (ROE) (%)
25
2017 105 1,279
20
2018 77 827
2019 79 694
11
9
2020 73 475
LNG
2021 82 246
PNG
2020
2017 2018 2019 -1 2021
Summary Financial Indicators (TL M)
2021 / 2020
2021 2020 2019 2018 2017 Change
Sales revenues 15,893 10,145 10,211 9,554 8,469 57%
Gross profit 1,438 912 957 634 741 58%
Operating profit 418 241 365 71 265 74%
Pre-tax profit 697 31 306 250 621 -
Net profit* 670 -25 273 228 577 -
EBITDA** 705 416 476 208 335 69%
Gross profit margin 9% 9% 9% 7% 9% -
Operating profit margin 3% 2% 4% 1% 3% 1
Net profit margin 4% -0,2% 3% 2% 7% 4
EBITDA margin 4% 4% 5% 2% 4% -
Current assets 4,638 2,193 1,589 1,618 1,588 111%
Fixed assets 3,696 3,202 3,366 3,396 3,379 15%
Total assets 8,333 5,395 4,955 5,013 4,966 54%
Short term liabilities 3,869 1,852 1,495 1,484 1,279 109%
Long term liabilities 1,745 1,226 982 1,027 764 42%
Shareholders' equity 2,698 2,317 2,478 2,502 2,923 16%
Total equity and liabilities 8,333 5,395 4,955 5,013 4,966 54%
Return on equity (ROE) 25% -1% 11% 9% 20% 26
Net debt/equity ratio 32% 26% 24% 30% 13% 6
Current ratio 1.20 1.18 1.06 1.09 1.24 0.02